
Month: June 2026

How a leading insurance company went from office-hours selling to 84% more policies per agent
Before Hubtel:
An insurance company that could only sell when its offices were open
Ghana’s insurance market runs on agents and brokers. An agent or broker finds the customer, explains the product, processes the policy, and collects the premium. The system works when the agent can work. When the agent cannot, nothing moves.
For this insurer, that meant every sale depended on office hours. A customer who wanted to buy a motor policy on a Saturday had one option: wait until Monday. An agent who had a willing buyer at 7pm had no way to close the sale at such an hour. They would have to call a branch colleague, ask someone to log in on their behalf, or tell the customer to come back during the week. Some customers came back. Many did not.
Payments, when they did come in, arrived through every channel available. Cash at the counter. Mobile money. Bank transfers. Cheques. Each one landed in a different place and stayed there until someone manually pulled it all together.
The reporting system they used was only accessible to staff. That meant a customer who wanted to buy could not do it on their own. An agent who wanted to sign someone on could not do that. Every transaction required a branch, a desk, and someone sitting at it.
Insurance is a business built on relationships and timing. The relationship part worked. The timing did not. Customers who needed to act outside working hours had nowhere to go, and agents who wanted to serve them had no tool to help.
Bringing Clarity:
Putting insurance in the hands of agents and customers, wherever they are
Hubtel came onboard to build a digital distribution and management system that would allow the business sell and serve outside the limits of its branches. The solution was direct: give agents a mobile tool, give customers a self-service option, and give branch staff a live view of the policies in their care.
Hubtel built three interconnected portals and refreshed the company’s website.
The Agent Portal was designed to work anytime, anywhere. An agent can now generate an insurance sticker, process a motor policy, or renew a travel policy from wherever they are. A customer who wants to buy on a Saturday afternoon can complete the transaction with their agent without either of them needing to set foot in a branch.
The Customer Portal gives policyholders direct access to their own accounts. They can buy a motor or travel policy, renew an existing one, or manage multiple policies from their device.
The Staff Portal gives branch teams a live view of what is happening in their branch: active policies, the total premiums those policies represent, and policies expiring within the next 90 days. Before this, a branch manager who wanted to know how many customers were coming up for renewal had to run a manual report from the system.
Alongside the three portals, the company’s website was reorganized. An AI-powered chatbot, built to handle customer inquiries and capture leads, was integrated into the site. The chatbot has since generated significant customer interaction volume, helping the business understand what customers are asking and what they need before they ever speak to an agent.
The five components Hubtel built:
| Component | What It Does |
| Agent Portal | Platform for agents to sell and renew policies at any time, including evenings and weekends |
| Customer Portal | Self-service platform for customers to buy, renew, or manage policies directly |
| Staff Portal | Branch dashboard showing active policies, total premiums, and policies expiring within 90 days |
| Website Refresh | Reorganised site with direct link to the Customer Portal on the homepage for frictionless customer access |
| AI Chatbot | Customer inquiry and lead capture tool integrated into the website, running around the clock |
Putting Management in Control:
A live view of what every branch holds and what every agent earns
Before the portals existed, staff relied on an internal system to understand what had been collected and which policies were active. The Staff Portal introduced a better management system.
A branch manager can now open the portal and see exactly how many policies are active, how much premium those policies represent, and how many customers are approaching their renewal date. Policies expiring within 90 days are surfaced directly, giving staff a clear, time-sensitive list to work from rather than a report they must search through.
For the business, the Agent Portal introduced a layer of performance visibility. Every transaction an agent processes goes through the portal; the business can now see how much each agent is collecting, in which months, and from which policy lines. That data is the foundation for understanding which agents are most productive and where additional support or incentive would have the most impact.
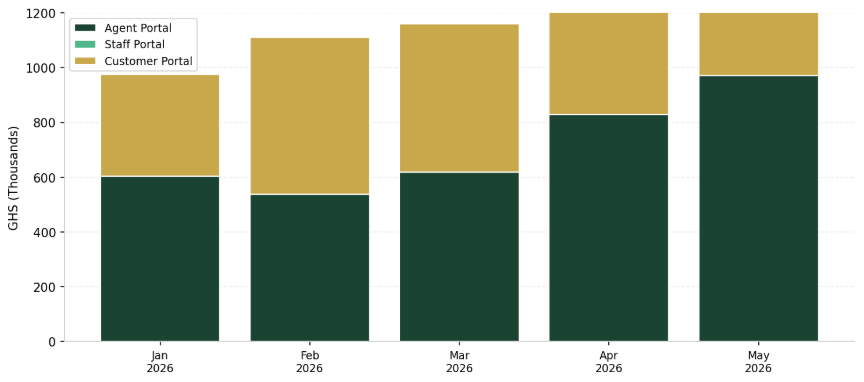
The monthly collection data from the Agent Portal tells its own story. In January 2026, agents collected GHS 604,794 through the portal. By May 2026, that figure had grown to GHS 970,649; a 60% increase in five months. The business can see that growth in real time and make decisions based on what is happening, not on what happened last month.
What changed operationally:
| Area | Before Hubtel | After Hubtel |
| Agent hours | Agents could only process policies during branch office hours | Agents sell and renew policies at any time, any day |
| Customer access | Customers had to visit a branch or call an agent during working hours | Customers buy and renew policies directly from any phone, at any time |
| Branch visibility | Policy and renewal data pulled from existing system | Live dashboard: active policies, total premiums, and 90-day expiry list |
| Agent performance | No channel to track individual agent policy volumes digitally | Every portal transaction attributed to the agent, visible in real time |
Pursuing Growth:
What agents with better tools produce
The clearest proof of what the platform has produced is in comparison between agents who use it and agents who do not.
Between January and May 2025, we tracked the performance of two groups of agents: 50 agents actively using the Agent Portal and 462 who were not. The portal agents sold an average of 16.87 policies per month. The non-portal agents sold an average of 9.16 per month. On a per-agent basis, portal users sold 84% more policies than their counterparts who were still working without a digital tool.
Figure 1: Average policies sold per agent per month, January to May 2025
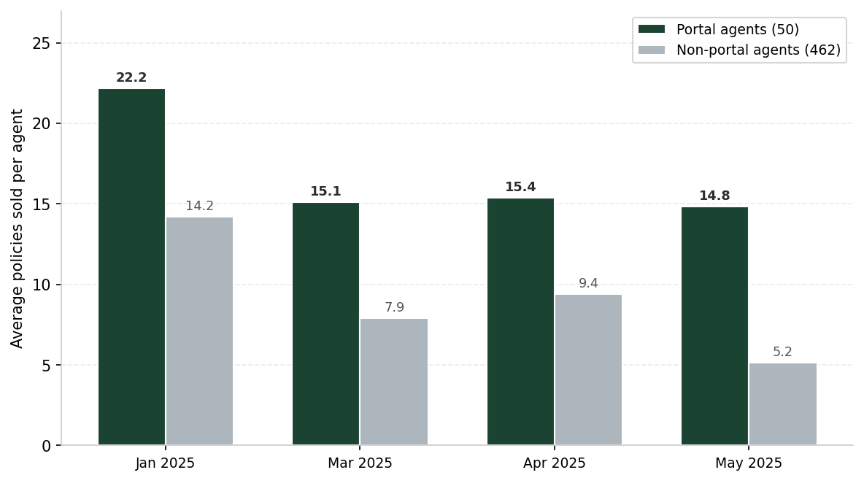
The consistency of that advantage matters as much as the average. The portal agents outperformed non-portal agents in every month tracked: January, March, April, and May. The gap was widest in May, where portal agents averaged 14.82 policies against 5.16 for non-portal agents, a difference of nearly 3 to 1 that month. The advantage was not a single month of strong performance. It held across the whole period.
The portal collection figures show the same direction of travel. In October 2024, when the portals first went live, total monthly collections through all three portals came to GHS 3,865. By July 2025, that figure had reached GHS 1.67 million in a single month. That is a growth of more than 430 times in nine months.
Figure 2: Monthly collections through all portals, October 2024 to May 2026 (GHS)
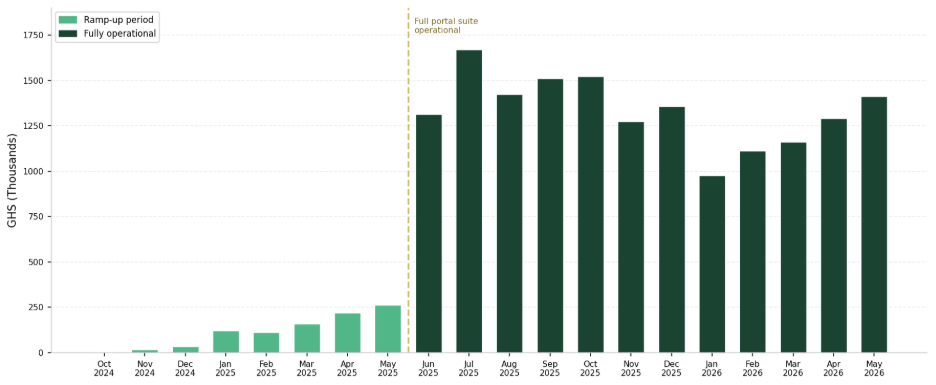
By 2026, the Agent Portal had become the dominant collection channel. Of the GHS 1.41 million collected across all portals in May 2026, the Agent Portal accounted for GHS 970,649, just under 69% of the total. The Customer Portal, which allows policyholders to transact directly without an agent, contributed GHS 114,765, its highest monthly figure to date and a sign that direct customer adoption is also building.
Figure 3: Portal collections by channel, January to May 2026 (GHS Thousands)
Collections grew from GHS 3.32 million in 2021 to GHS 19.74 million in 2025, an increase of 495% over four years. The 2025 total was the strongest year on record, supported by a 101.8% increase in transaction volume that year alone.
Figure 4: Annual collections received via Hubtel, 2021 to 2026 YTD (GHS Millions)
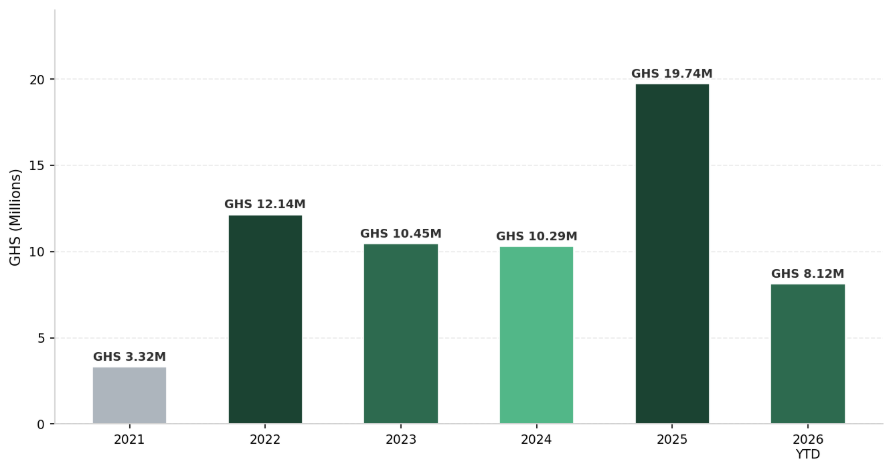
The year-by-year breakdown:
| Year | Amount Received (GHS) | Transactions | Avg per Transaction |
| 2021 | GHS 3.32M | 9,326 | GHS 355.99 |
| 2022 | GHS 12.14M | 31,355 | GHS 387.25 |
| 2023 | GHS 10.45M | 20,036 | GHS 521.70 |
| 2024 | GHS 10.29M | 17,626 | GHS 583.53 |
| 2025 | GHS 19.74M | 35,561 | GHS 555.12 |
| 2026 YTD (to May) | GHS 8.12M | 13,785 | GHS 589.07 |
The average transaction value grew from GHS 355.99 in 2021 to GHS 589.07 per customer by May 2026. This indicates that customers are not just paying more often. They are also paying for larger and more valuable policies each time. That is a sign of deeper engagement with the product, not just higher volumes going through the same channel.
The Agent Portal has 50 active users who consistently outperform a group eight times larger that does not use it. The portals collectively processed GHS 1.41 million in May 2026, up from GHS 3,865 nineteen months earlier. And the average transaction value is rising every year. These numbers point in the same direction: the agents and customers who are using the platform are doing more business, at higher values, with more consistency than those who are not.









Related
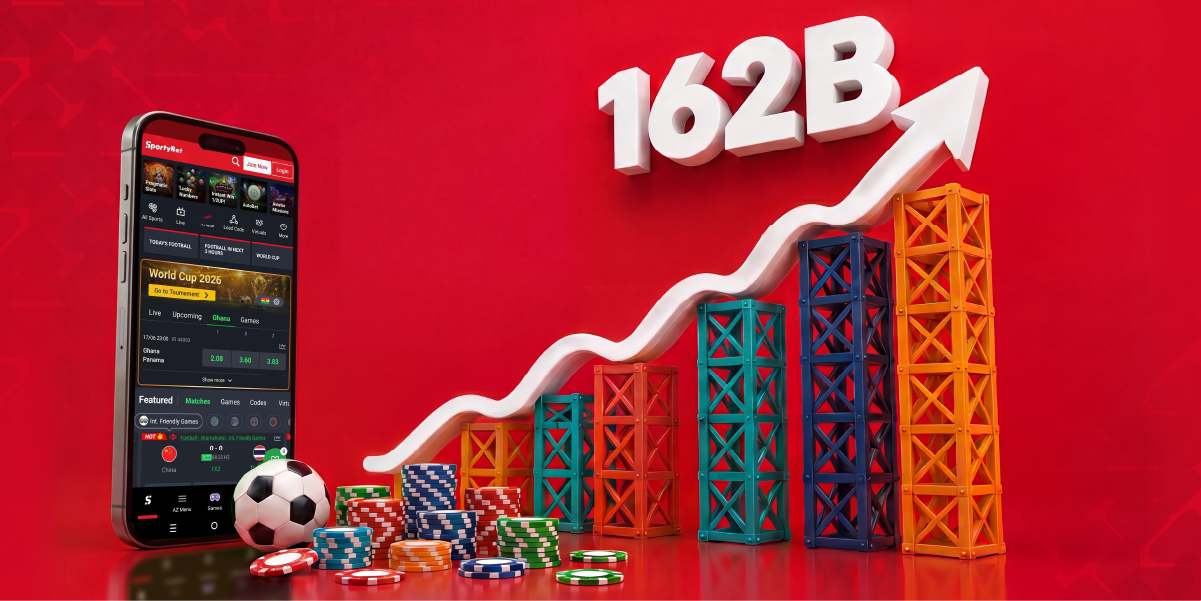
From zero to GHS 162B: how a Pan-African gaming & entertainment company built its entire Ghana payment operation on Hubtel
June 25, 2026| 8-minute read

How Ghana's largest power distributor went from collecting less than 22% of its revenue potential to processing GHS 51 billion through a single platform
June 24, 2026| 11-minute read
From zero to GHS 162B: how a Pan-African gaming & entertainment company built its entire Ghana payment operation on Hubtel
Before Hubtel:
A gaming & entertainment company entering Ghana with no payment infrastructure
A leading pan-African sports gaming & entertainment company entered the Ghanaian market with a strong product and a large customer base already built across other African markets. What they did not have was a way to collect money or pay money out to their customers.
In the gaming & entertainment industry, a customer usually deposits money into their account, places a bet, and if they win, expects to receive their winnings quickly. Those two actions, depositing and withdrawing, are the core of the business. If either of them fails, even for a few minutes, the customer notices immediately and the business stands at risk of losing trust. The faster the event, the faster the expectation. A customer watching a live match and trying to place a bet has very little tolerance for payment glitches.
Finding a payment processor that could handle that kind of volume in Ghana was paramount. The company needed a partner that could process deposits at very high speed, disburse winnings just as fast, and hold up reliably during the peak moments when thousands of customers are active at the same time.
They also needed payment channels that reached all their customers, not just those with smartphones or bank accounts. Customers who did not have smartphones needed a USSD code to transact. Any payment solution that worked only for smartphone users would leave a fraction of the market unreachable.
Hubtel was the first payment processor the company worked with in Ghana. There was no existing infrastructure to migrate from. The entire payment operation was built from a standing start.
Bringing Clarity:
Building the payment infrastructure the business needed to operate
Hubtel connected the two core payment flows the business runs on. The Receive Money API handles customer deposits: a customer adds funds to their account using mobile money or bank, and the transaction is confirmed instantly. The Send Money API handles disbursements: when a customer wins a bet, the winnings are sent directly to their mobile money. Both APIs were exactly what the business needed to handle the speed and volume that a live gaming & entertainment operation demands.
We also provided a USSD payment channel to reach customers who did not use smartphones. A customer can deposit into their account by dialing a short code, without needing internet access.
On top of the payment channels, we provided a set of supporting services. An SMS and Notification API to deliver one-time passwords, transaction confirmations, and campaign messages to customers. A Balance Query API lets the operator check account balances programmatically. A Transfer API moves funds between accounts. A Merchant Dashboard gives the operator’s team a view of transaction activity across all channels in one place.
The demands placed on this infrastructure were significant from the start. In the gaming & entertainment industry, transactions usually arrive in bursts, concentrated around major fixtures and live events. During a Champions League evening or a major African competition, the volume of deposit and withdrawal requests rises sharply in a very short window. Building infrastructure that could absorb those spikes without slowing down or failing required Hubtel to invest deeply in the reliability and capacity of its payment platform. The infrastructure we provided to serve this business became the most capable version of its payment systems at that point in time.
The solutions Hubtel provides to the operator:
| Service | What It Does |
| Receive Money API | Processes customer deposits into their accounts via mobile money or bank, instantly |
| Send Money API | Disburses winnings directly to customer mobile money accounts |
| USSD Payment Service | Allows customers to deposit via short code, no smartphone or internet needed |
| SMS API | Delivers OTPs, transaction confirmations, and messages to customers |
| Balance Query API | Allows the operator to check account balances programmatically |
| Transfer API | Moves funds between accounts as needed |
| Merchant Dashboard | Gives the operator a consolidated view of all transaction activity |
Putting Management in Control:
Reliability as the foundation of a high-volume operation
For a business that processes transactions around major sporting events, the most important thing a payment platform can provide is not just speed. It is consistency. A system that works well most of the time but fails during the moments of highest demand is not a system a gaming & entertainment operator can build on.
The Merchant Dashboard gives the operator’s team a real-time view of what is flowing in and out across all payment channels. Deposits, disbursements, transaction counts, and channel performance are visible in one place. When a live event is driving high volumes, the team can see what is happening on the dashboard as it happens, rather than finding out after the fact.
Five years on, we have processed 2.98 billion successful transactions. The word successful in that figure carries operational weight. It means the vast majority of what customers have tried to do has worked.
Pursuing Growth:
Five years, GHS 162 billion, and a record set every year
In 2021, Hubtel processed GHS 5.94 billion in combined transaction value for the operator across all payment channels. In 2025, that figure was GHS 52.53 billion. From one year to the next, across every year in the dataset, the total has grown.
Figure 1: Combined transaction value processed by Hubtel, 2021 to 2026 YTD (GHS Billions)
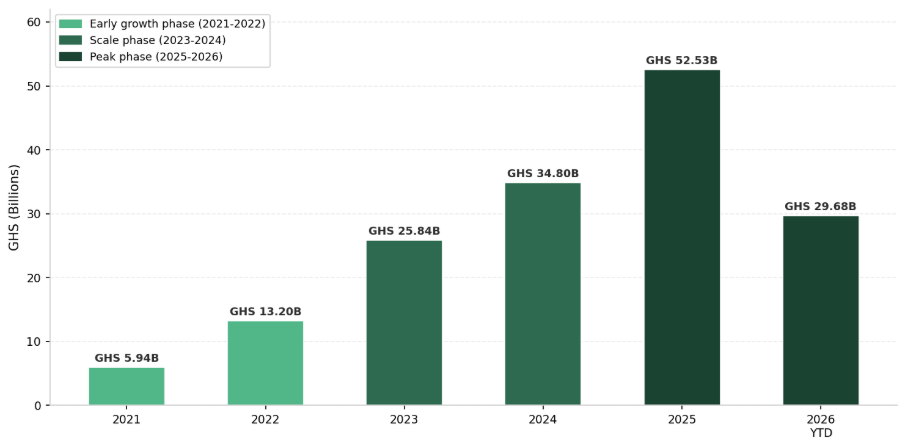
The growth was steepest in the early years. Combined transaction value grew 122% in 2022 and 96% in 2023. These were the years in which the operator established its full commercial scale in Ghana, building a customer base and a volume of activity that has continued to grow since.
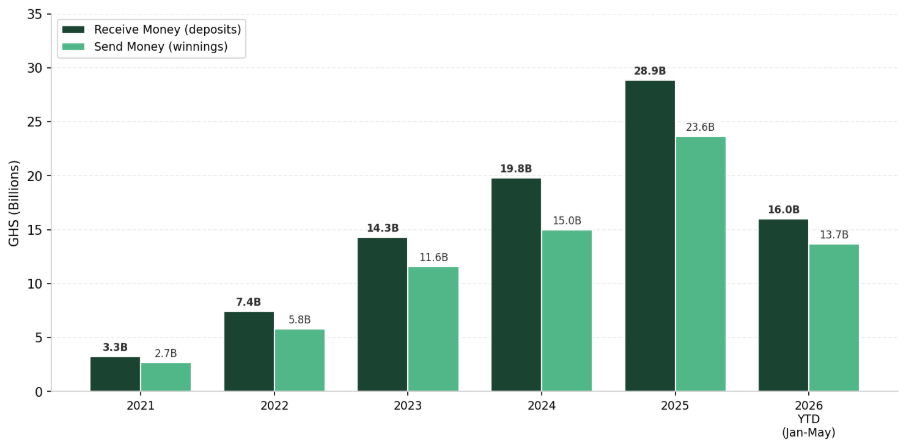
By 2025, we had processed GHS 28.88 billion in deposits alone across 625.1 million transactions. That is an average of more than 1.7 million deposit transactions every single day of the year. The Send Money API processed GHS 23.65 billion in the same year, distributing winnings to customers across 100 million individual disbursements.
Figure 2: Receive Money and Send Money volumes by year, 2021 to 2026 YTD (GHS Billions)
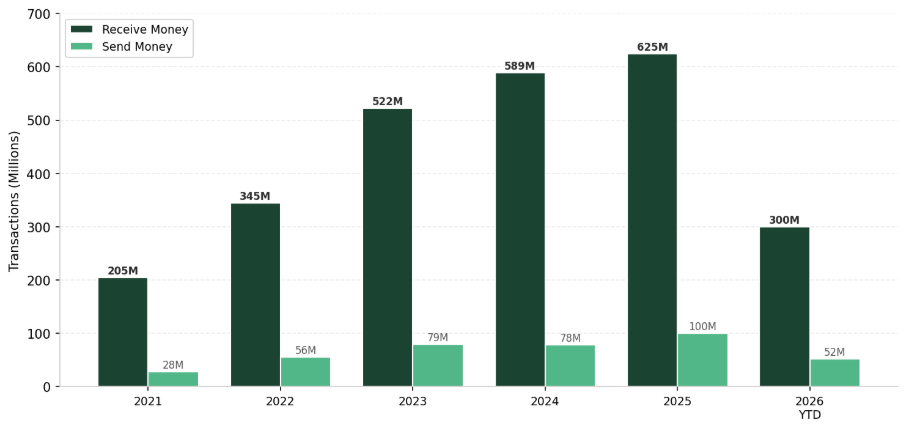
Transaction volumes tell the same story from a different angle. On the Receive Money API, the number of deposit transactions grew from 204.6 million in 2021 to 625.1 million in 2025. On the Send Money API, disbursement transactions grew from 28.1 million to 100 million over the same period. Together, both API processed 725 million transactions in 2025 alone.
Figure 3: Transaction volume by channel, 2021 to 2026 YTD (Millions)
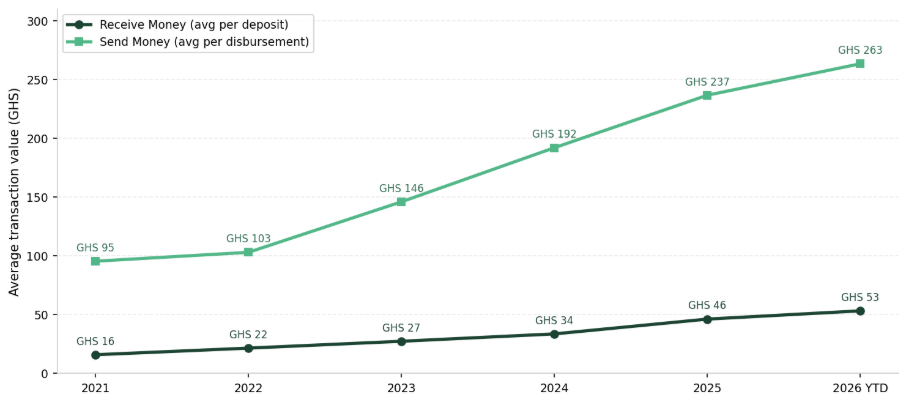
In 2021, the average Receive Money transaction per customer was worth GHS 15.91. By the first five months of 2026, it had grown to GHS 53.22. On the Send Money API, the average disbursement grew from GHS 95.43 in 2021 to GHS 263.28 in 2026 YTD. This indicates that customers are not only transacting more often. They are transacting at meaningfully higher values each time.
Figure 4: Average transaction value by channel, 2021 to 2026 YTD (GHS)
The full year-by-year breakdown:
| Year | Receive Money | Send Money | Combined Total | YoY Growth | Transactions |
| 2021 | GHS 3.26B | GHS 2.68B | GHS 5.94B | Base year | 232.7M |
| 2022 | GHS 7.42B | GHS 5.78B | GHS 13.20B | +122% | 400.7M |
| 2023 | GHS 14.28B | GHS 11.56B | GHS 25.84B | +96% | 601.3M |
| 2024 | GHS 19.81B | GHS 14.99B | GHS 34.80B | +35% | 667.5M |
| 2025 | GHS 28.88B | GHS 23.65B | GHS 52.53B | +51% | 725.0M |
| 2026 YTD (Jan-May) | GHS 15.98B | GHS 13.70B | GHS 29.68B | On pace to exceed 2025 | 352.4M |
By May 2026, Hubtel had already processed GHS 29.68 billion for the operator in the first five months of the year. That is more than the entire combined value for 2022 in less than half the time. If the pace holds, 2026 will set a new record. What started as a connection between a new market entrant and a local payment processor has, over five years, become one of the largest payment operations in Ghana, and by every available measure, it is still accelerating.
Warning: Constant COLOR_SCHEME_BLUE already defined in /var/www/html/bloghubtel/wp-content/themes/bloghubtel/template-parts/content-mobile-app-banner.php on line 3
Warning: Constant COLOR_SCHEME_RED already defined in /var/www/html/bloghubtel/wp-content/themes/bloghubtel/template-parts/content-mobile-app-banner.php on line 4
Warning: Constant COLOR_SCHEME_LIGHT already defined in /var/www/html/bloghubtel/wp-content/themes/bloghubtel/template-parts/content-mobile-app-banner.php on line 5
Warning: Constant FACEBOOK_SHARE_URL already defined in /var/www/html/bloghubtel/wp-content/themes/bloghubtel/template-parts/content-mobile-app-banner.php on line 8
Warning: Constant LINKEDIN_SHARE_URL already defined in /var/www/html/bloghubtel/wp-content/themes/bloghubtel/template-parts/content-mobile-app-banner.php on line 9
Warning: Constant TWITTER_SHARE_URL already defined in /var/www/html/bloghubtel/wp-content/themes/bloghubtel/template-parts/content-mobile-app-banner.php on line 10
Warning: Constant WHATSAPP_SHARE_URL already defined in /var/www/html/bloghubtel/wp-content/themes/bloghubtel/template-parts/content-mobile-app-banner.php on line 11
Warning: Constant CUSTOM_ADS_CONTENT_WRAPPER already defined in /var/www/html/bloghubtel/wp-content/themes/bloghubtel/template-parts/content-mobile-app-banner.php on line 14
Warning: Constant IMAGE_WRAPPER_CLASSES already defined in /var/www/html/bloghubtel/wp-content/themes/bloghubtel/template-parts/content-mobile-app-banner.php on line 15
Warning: Constant APPLE_APP_STORE_URL already defined in /var/www/html/bloghubtel/wp-content/themes/bloghubtel/template-parts/content-mobile-app-banner.php on line 18
Warning: Constant GOOGLE_PLAY_STORE_URL already defined in /var/www/html/bloghubtel/wp-content/themes/bloghubtel/template-parts/content-mobile-app-banner.php on line 19
Warning: Constant HUAWEI_APP_GALLERY_URL already defined in /var/www/html/bloghubtel/wp-content/themes/bloghubtel/template-parts/content-mobile-app-banner.php on line 20
Related
How a leading insurance company went from office-hours selling to 84% more policies per agent
June 26, 2026| 9-minute read
How Ghana's largest power distributor went from collecting less than 22% of its revenue potential to processing GHS 51 billion through a single platform
June 24, 2026| 11-minute read
How Ghana’s largest power distributor went from collecting less than 22% of its revenue potential to processing GHS 51 billion through a single platform
Before Hubtel:
A power utility was unable to fully collect revenue for the electricity it distributed
Ghana’s largest power distributor is the sole entity mandated to supply and sell electricity across southern Ghana. It serves millions of customer connections, residential, commercial, and industrial, and is responsible for one of the most critical infrastructure operations in the country.
For over a decade, annual sales growth had consistently remained below average inflation. The organization knew revenue was being lost. What it could not do was see exactly where, measure how much, or act on it in time to make a difference. The problem ran deeper than a leaking pipe. It ran through every stage of the revenue chain.
Each month more than GHS 2.1 billion worth of power was consumed across the network. By the time that energy was billed, the figure had dropped to just over GHS 1 billion. By the time bills were captured as paid, it had fallen further to roughly GHS 600 million. And by the time money was deposited and available, less than GHS 450 million remained.
Every single month, more than GHS 1.6 billion in value was produced and delivered to customers but never converted into usable revenue.
| Stage | Description | Monthly Value | % of Consumed |
| Stage 1 Power Consumed | Electricity delivered across the network | GHS 2.1B+ | 100% |
| Stage 2 Power Billed | Invoices issued to customers | GHS 1.0B+ | ~48% |
| Stage 3 Captured as Paid | Bills acknowledged as settled in the system | GHS 600M+ | ~29% |
| Stage 4 Deposited and Available | Cash in the organization’s bank accounts | Less than GHS 450M | ~21% |
| Revenue recovery rate Less than 22% of the value of power consumed reached the organization as usable revenue each month | |||
The causes were structural and spread across every layer of operations. Payments came in through mobile money, cash, third-party vendors, bank transfers, and cheques. None of these channels were connected to each other. None fed a single system. Finance teams reconciled manually across all of them, a process that consumed days. Sometimes weeks. With Oracle 10G databases running commercial operations, the infrastructure itself was a decade behind where it needed to be.
Metering systems failed regularly with no dedicated monitoring. Prepaid meters were disconnected from any centralized consumption tracking. Internal analysis would later reveal that 1 in every 3 prepaid meters had a technical issue affecting how consumption was accurately billed, and that inaccurate meter billing was the single biggest contributor to commercial losses on the prepaid estate. For every 2 metered customers on the network, there was 1 unknown consumer drawing power with no account attached to them at all.
The result was a business generating enormous output that was, in practical terms, flying without instruments. Leadership received revenue reports that were described last week, or last month. The decisions made from those reports were already out of date before they were acted on. There was no mechanism to catch a fraud case developing in the field, identify a meter draining revenue quietly in Ashanti West, or see in real time which districts were underperforming and why.
Before Hubtel’s intervention, the highest monthly revenue ever recorded on the PowerApp platform was GHS 30.02 million. In the five years from 2017 to August 2022, the platform generated a cumulative total of GHS 546.67 million.
Bringing Clarity:
Building the instruments the business had never had
Hubtel’s engagement began in November 2022. The objective was not to bolt a payment layer on top of an existing system. It was to rebuild the commercial infrastructure from the ground up, close every gap in the revenue chain, and give leadership instruments to actually see what was happening across the network in real time.
Phase 1 ran from November 2022 to April 2023, focused entirely on fixing payment processing losses. The fragmented payment channels were replaced with a single unified framework. The PowerApp was rebuilt as the primary point of interaction for all customers and all payment types. Third-party vendor quota systems were centralised and fully integrated with the banking system.
Bill payments for both AMR and non-AMR customers were brought into a single platform with direct bank and fintech connectivity. Bonded cashiers and POS agents were brought into the framework. The Oracle 10G infrastructure was replaced with Oracle 19C. A 24/7 monitoring team was deployed to maintain system availability around the clock.
The impact was immediate and visible in the monthly numbers. In November 2022, revenue through the platform stood at GHS 14 million. By December it had reached GHS 90 million. By January 2023, GHS 231 million. By February, GHS 815 million. By March 2023, the month the new framework reached full deployment across all 16 metering systems combined with bank and fintech integrations and bonded cashiers. Collections hit GHS 972 million in a single month.
The milestone the organisation had been targeting, GHS 1 billion in monthly revenue, was within reach for the first time.
| Month | Revenue | Milestone | Rollout Status |
| November 2022 | GHS 14M | PowerApp 2.0 live | Initial platform launch |
| December 2022 | GHS 90M | Quota TopUps from 5 of 16 metering systems added | Partial metering integration |
| January 2023 | GHS 231M | Quota TopUps expanded to 12 of 16 metering systems | Expanded system coverage |
| February 2023 | GHS 815M | All 16 metering systems live; Bank and Fintech Collections added | Full metering plus payment channel integration |
| March 2023 | GHS 972M | Bonded Cashiers added; full framework operational | End-to-end framework deployment |
Phase 2 ran from September 2023 to February 2024 and addressed the deeper structural problem: revenue protection. Consumption was happening that the organisation could not see and therefore could not bill for. Hubtel introduced Cloud Consumption Monitoring, a system that queries every prepaid meter on the network for monthly consumption data and compares it against actual payments made. The gap between the two reveals precisely where revenue is being lost, at the meter level, for every customer across the entire estate.
Alongside Cloud Consumption Monitoring, OperationZero was deployed. Built using deep neural network architecture and AI-driven anomaly detection, OperationZero analyses large-scale consumption and vending data to identify illegal connections, tampered meters, and customers consuming power at volumes that do not match their payment history. It does not flag possibilities. It identifies confirmed cases for field teams to act on.
The PowerApp itself was also deepened into a full customer-facing commercial platform. Customers gained daily consumption estimates, self-service meter reading, monthly statements downloadable as PDFs, and real-time postpaid bill visibility. PowerApp users grew from approximately 5 million at the start of 2025 to more than 7 million by January 2026.
Putting Management in Control:
From historical reports to live decisions
Before the platform existed in its current form, asking how much had been collected today required waiting until the finance team had reconciled multiple disconnected systems, a process that took days and produced figures nobody could fully trust.
That changed with a single dashboard.
From the moment any payment is made, through any channel, by any customer, it appears. The total for the day, the breakdown by payment type, and the variance against the previous period. Directors, management assignees, and performance analysts can see the same data at the same time, without waiting for a report to be compiled. Reconciliation, which once stretched across days, now runs against a single source of truth and produces results on demand.
At the field level, Cloud Consumption Monitoring put specific, actionable data in front of operations teams for the first time. Analysis of the SmartG metering system alone revealed that across 2024, customers consumed GHS 516.3 million worth of electricity but made payments totalling only GHS 374.2 million, a gap of GHS 142.1 million from a single metering system in a single year. Before this system existed, that gap was invisible. There was no mechanism to detect it, no data to quantify it, and no way to assign it to specific accounts for follow-up.
| Month | Billed | Paid | Loss |
| January 2024 | GHS 52.6M | GHS 34.0M | GHS 18.6M |
| February 2024 | GHS 41.1M | GHS 32.2M | GHS 8.9M |
| March 2024 | GHS 35.2M | GHS 31.6M | GHS 3.7M |
| April 2024 | GHS 36.0M | GHS 31.1M | GHS 4.9M |
| May 2024 | GHS 44.8M | GHS 31.5M | GHS 13.3M |
| June 2024 | GHS 50.5M | GHS 28.1M | GHS 22.4M |
| July 2024 | GHS 51.2M | GHS 29.9M | GHS 21.3M |
| August 2024 | GHS 37.8M | GHS 27.7M | GHS 10.1M |
| September 2024 | GHS 53.6M | GHS 28.6M | GHS 25.0M |
| October 2024 | GHS 41.3M | GHS 31.0M | GHS 10.3M |
| November 2024 | GHS 37.7M | GHS 34.4M | GHS 3.3M |
| December 2024 | GHS 34.5M | GHS 34.1M | GHS 338K |
| Full Year 2024 | GHS 516.3M | GHS 374.2M | GHS 142.1M |
Every row on that table is now actionable. The accounts, the districts, the meters, the customers. All of it is visible and available to the field teams responsible for closing the gap.
Pursuing Growth:
What happened when the instruments were finally working
In the first partial year on the platform, from November 2022 through December 2022, GHS 86.16 million flowed through Hubtel across 551,504 transactions. In 2023, the first full year of operation following the complete Phase 1 deployment, GHS 11.94 billion was processed across 18.5 million transactions. That number grew to GHS 17.65 billion in 2024, the strongest full year on record, with transaction volume nearly doubling to 35.6 million. In 2025, the GHS value of transactions processed came in at GHS 14.48 billion, but transaction volume rose to 65.9 million, an 85% increase over 2024.
That shift in 2025 is worth explaining directly. The average Receive Money transaction fell from GHS 657 in 2023 to GHS 222 in 2025. This is not a decline. It is a maturing platform. Millions of customers who previously paid in large, infrequent amounts are now paying smaller amounts more often. The platform is deeper in customer behaviour than it was before. By May 2026, GHS 6.87 billion had already been processed in the year to date across 38.7 million transactions. March 2026 recorded the highest single month for transaction volume in the platform’s entire history: 8.24 million transactions in one month.
Annual platform performance
| Period | Total Flow | Transactions | Growth | Average per Transaction |
| 2022 YTD | GHS 86.16M | 551,504 | — | GHS 156.22 |
| 2023 | GHS 11.94B | 18.5M | +13,757% value growth | GHS 645.55 |
| 2024 | GHS 17.65B | 35.6M | +47.8% value growth; +92.4% volume growth | GHS 495.82 |
| 2025 | GHS 14.48B | 65.9M | +85.2% volume growth | GHS 219.82 |
| 2026 YTD (to May) | GHS 6.87B | 38.7M | — | GHS 177.56 |
The last time comparable revenue growth was recorded was in 2001.
The Impact So Far
The platform Ghana’s largest power distributor runs on today is not static, but the results it has already produced tell a clear story about what clarity and control actually deliver at scale.
Before the platform existed, less than 22% of the value of power consumed each month reached the organisation as usable revenue. Monthly collections on the PowerApp peaked at GHS 30.02 million over the five years from 2017 to August 2022. Within five months of the new payment framework going live, that figure had grown to GHS 972 million. Within one full year of operation, GHS 11.94 billion had been processed. By 2024, GHS 17.65 billion. By 2026, the platform is processing more than GHS 1.4 billion in a single month.
Clarity made the invisible visible. Control made the visible actionable. Growth followed because it had no choice.
Warning: Constant COLOR_SCHEME_BLUE already defined in /var/www/html/bloghubtel/wp-content/themes/bloghubtel/template-parts/content-mobile-app-banner.php on line 3
Warning: Constant COLOR_SCHEME_RED already defined in /var/www/html/bloghubtel/wp-content/themes/bloghubtel/template-parts/content-mobile-app-banner.php on line 4
Warning: Constant COLOR_SCHEME_LIGHT already defined in /var/www/html/bloghubtel/wp-content/themes/bloghubtel/template-parts/content-mobile-app-banner.php on line 5
Warning: Constant FACEBOOK_SHARE_URL already defined in /var/www/html/bloghubtel/wp-content/themes/bloghubtel/template-parts/content-mobile-app-banner.php on line 8
Warning: Constant LINKEDIN_SHARE_URL already defined in /var/www/html/bloghubtel/wp-content/themes/bloghubtel/template-parts/content-mobile-app-banner.php on line 9
Warning: Constant TWITTER_SHARE_URL already defined in /var/www/html/bloghubtel/wp-content/themes/bloghubtel/template-parts/content-mobile-app-banner.php on line 10
Warning: Constant WHATSAPP_SHARE_URL already defined in /var/www/html/bloghubtel/wp-content/themes/bloghubtel/template-parts/content-mobile-app-banner.php on line 11
Warning: Constant CUSTOM_ADS_CONTENT_WRAPPER already defined in /var/www/html/bloghubtel/wp-content/themes/bloghubtel/template-parts/content-mobile-app-banner.php on line 14
Warning: Constant IMAGE_WRAPPER_CLASSES already defined in /var/www/html/bloghubtel/wp-content/themes/bloghubtel/template-parts/content-mobile-app-banner.php on line 15
Warning: Constant APPLE_APP_STORE_URL already defined in /var/www/html/bloghubtel/wp-content/themes/bloghubtel/template-parts/content-mobile-app-banner.php on line 18
Warning: Constant GOOGLE_PLAY_STORE_URL already defined in /var/www/html/bloghubtel/wp-content/themes/bloghubtel/template-parts/content-mobile-app-banner.php on line 19
Warning: Constant HUAWEI_APP_GALLERY_URL already defined in /var/www/html/bloghubtel/wp-content/themes/bloghubtel/template-parts/content-mobile-app-banner.php on line 20
Related
How a leading insurance company went from office-hours selling to 84% more policies per agent
June 26, 2026| 9-minute read
From zero to GHS 162B: how a Pan-African gaming & entertainment company built its entire Ghana payment operation on Hubtel
June 25, 2026| 8-minute read